


Abstract
Functional magnetic resonance imaging was used to study the cortical bases of 3-D structure perception from visual motion in human. Nine subjects underwent three experiments designed to locate the areas involved in (i) motion processing (random motion versus static dots), (ii) coherent motion processing (expansion/ contraction versus random motion) and (iii) 3-D shape from motion reconstruction (3-D surface oscillating in depth versus random motion). Two control experiments tested the specific influence of speed distribution and surface curvature on the activation results. All stimuli consisted of random dots so that motion parallax was the only cue available for 3-D shape perception. As expected, random motion compared with static dots induced strong activity in areas V1/V2, V5+ and the superior occipital gyrus (SOG; presumptive V3/V3A). V1/V2 and V5+ showed no activity increase when comparing coherent motion (expansion or 3-D surface) with random motion. Conversely, V3/V3A and the dorsal parieto-occipital junction were highlighted in both comparisons and showed gradually increased activity for random motion, coherent motion and a curved surface rotating in depth, which suggests their involvement in the coding of 3-D shape from motion. Also, the ventral aspect of the left occipito-temporal junction was found to be equally responsive to random and coherent motion stimuli, but showed a specific sensitivity to curved 3-D surfaces compared with plane surfaces. As this region is already known to be involved in the coding of static object shape, our results suggest that it might integrate various cues for the perception of 3-D shape.
Introduction
During self-motion or object motion, the pattern of retinal motion which is projected on the retina is a rich source of 3-D information, also called optic flow. For example, the expansion or contraction of a visual pattern is a powerful cue for the perception of object-translation or self-translation in depth (Regan and Beverley, 1979). Also, observers can readily perceive the 3-D shape of objects in the visual scene from the optic flow induced by self-translation, or by the rotation of objects in depth (Rogers and Graham, 1979; Braunstein and Andersen, 1984; Cornilleau-Pérès and Droulez, 1994). Theoretically, 3-D shape and motion cannot be recovered separately from optic flow, since calculating the depth structure of the visual scene from optic flow directly induces the determination of 3-D motion and vice versa. However, as predicted computationally and shown in our pilot experiments, a pure translation in depth for small field visual stimulation (under 16° diameter) yields little 3-D shape information, whereas a rotation in depth allows a vivid perception of surface curvature. Hence stimuli eliciting a percept of 3-D motion may yield a strong or weak percept of 3-D shape if the simulated motion is a rotation in depth or a translation in depth, respectively.
Little is known about the neural bases underlying the reconstruction of a 3-D percept from optic flow. In the present study we use functional magnetic resonance at 3 T to explore the cortical pathways involved in such a capacity. The perception of 3-D structure from motion contributes to the representation of object shape, but also requires a spatial integration of visual motion. Therefore we first summarize the results related to both object shape representation and optic flow processing as the basis for motivating and interpreting our experiments.
The Cortical Coding of Object Shape
It is now widely accepted that the cortical visual pathway is divided in two parallel streams, the so-called dorsal (from V1 to the parietal lobe) and ventral (from V1 to the inferotemporal cortex) pathways, that are relatively independent (Ungerleider and Mishkin, 1982). Functionally the dorsal pathway mediates the visual perception of the movement and location of objects relative to the observer (‘where’), and of the observer's own movement and location. Goodale and Milner also suggested that the dorsal stream plays a specific role in object-oriented action (Goodale and Milner, 1992). Conversely, the ventral stream seems to be mainly involved in object recognition and identification (‘what’).
Both primate electrophysiology and human cortical imagery show that the coding of object shape from static monocular depth cues and binocular disparity is distributed in the dorsal and ventral visual pathways. This is in agreement with the view that information on object shape is necessary for recognizing objects, as well as for locating and manipulating them.
In man, the presentation of an object shape, as opposed to visual noise, induces an activity in the ventral pathway, particularly the fusiform gyrus (Malach et al., 1995; Martin et al., 1996), even if the object is perceived as a nonsense object. Also, Schacter et al. found that an activity in inferior temporal regions was elicited during a decision task about possible versus impossible 3-D objects (Schacter et al., 1995). A selectivity to object shape has also been repeatedly found in the infero temporal cortex of monkeys (Ungerleider and Haxby, 1994).
As for the dorsal pathway, Faillenot et al. compared a task of matching object shapes, to a task of pointing toward the centre of objects, in humans (Faillenot et al., 1997). Their positron emission tomography (PET) results showed an increased activity level for the task of matching an object shape not only in ventral areas, but also in the posterior parietal cortex. Similarly, the monkey intraparietal sulcus (area AIP) contains neurons that are driven by hand manipulation and respond selectively to the 3-D geometrical shape of the manipulated objects (Murata et al., 1993).
Optic Flow Processing and Extraction of 3-D Structure from Motion Parallax
Let us consider the case where the visual environment is made of rigid objects, and the relative motion between the object and observer is not a pure rotation around the observer's eye (in which case the optic flow is devoid of 3-D structure information). The variations of image velocity on the retina are then termed motion parallax. Psychophysical experiments and computational studies showed that 3-D structure can be recovered from motion parallax. In theory, this is possible if the retinal velocity is given (i) in a sufficient number of points (discrete approach) (Ullman, 1979) or (ii) within a retinal area large enough to compute the spatial derivatives of velocity (continuous approach) (Koenderink and van Doorn, 1975; Longuet-Higgins and Prazdny, 1980). These derivatives, also called the optic flow components, are computed at an intermediate stage.
The continuous model has been validated to a certain extent by electrophysiological investigations, since neurons sensitive specifically to one or several optic flow components have been found in the dorsal visual pathway of the primate. Such neurons are located in the dorsal part of area MST (Saito et al., 1986; Duffy and Wurtz, 1991), as well as in parietal areas such as VIP (Bremmer et al., 1997). Whether the neurons sensitive to optic flow components contribute to the coding of object shape, object motion or self-motion is still unclear. However, because they usually have large receptive fields and are also modulated by extraretinal signals of vestibular, tactile or proprioceptive origin (Andersen, 1987), several authors have hypothesized that their activity is related to self-motion rather than object motion (Duffy and Wurtz, 1991).
The visual motion area MT/V5 is also a major locus for optic flow processing (Newsome et al., 1989). Contrary to area MST, MT/V5 shows no tuning to the optic flow components (Orban et al., 1992). Nevertheless the role of MT/V5 in the spatial integration of visual motion has been demonstrated. Firstly, its neurons seem capable of integrating and segmenting different retinal motion components (Stoner and Albright, 1992). Secondly, unicellular responses in MT/V5 can be inhibited by the superposition ot two motion patterns moving in opposite directions (Snowden et al., 1991; Qian and Andersen, 1994), and this suppression is weaker if the two patterns have different binocular disparities (Bradley et al., 1995). Thirdly, Bradley et al. found a correlation between perceived 3-D motion and unicellular activity in MT (Bradley et al., 1998). Fourthly, the center–surround interactions demonstrated in MT/V5 neurons are possible mechanisms for spatial integration of retinal motion, which could subserve the specific sensitivity to the 3-D orientation of a moving plane in space (Xiao et al., 1997).
In summary, the properties of area MT/V5 related to the processing of retinal motion differ from what is seen in, for example, area MST. Although it does not seem to follow the continuous model described above, MT/V5 probably contributes to the 3-D processing of optic flow through its capacity to integrate or segment different motion signals. Finally, the functional role of MT/V5 seems to be distinct from the role of MST or parietal areas, because its activity is not modulated by extraretinal signals but depends only on retinal motion (Wurtz et al., 1990).
Dorsal and/or Ventral Implication in the Processing of 3-D Structure from Motion?
Binocular disparity, which is a critical cue for the perception of 3-D shape, is coded in the dorsal pathway [in MT/V5 (Maunsell and van Essen, 1983) and in MST (Roy et al., 1992)] and in the ventral pathway (Cowey and Porter, 1979; Schiller, 1993) of the monkey. The similarities between motion parallax and binocular disparity as depth cues are numerous, including psychophysical and computational aspects (Rogers and Graham, 1982; Cornilleau-Pérès and Droulez, 1993). Since both cues participate in the perception of 3-D object shape, the question arises whether motion parallax is also coded in both the ventral and dorsal visual pathways.
In addition, because of the large size of the receptive fields of neurons sensitive to optic flow components in MST and other parietal areas, it remains to be discovered whether these areas are involved in small-field analysis of 3-D shape from motion.
Given the physiological properties and functional roles of the ventral and dorsal visual pathways, a working hypothesis is that optic flows depicting little or no 3-D structure information (such as expansion/contraction) may be processed exclusively in the dorsal visual pathway, whereas a strong perception of 3-D shape from motion (such as during rotation in depth) might also involve the ventral pathway.
To address these questions in the human we used stimuli that consisted of random dot distributions moving coherently or not. Coherent motion stimuli could contain little or strong 3-D shape information. They contain no depth cue, except motion parallax. In addition, we compared random motion stimuli with static dots, so as to locate previously documented motion areas. Overall, two series of experiments were performed. The first series was designed to outline areas involved in the processing of motion and 3-D structure from motion. The second was designed to control for the influence of speed distribution and 3-D curvature in the areas delineated by the first series of experiments.
Main Experiments
Materials and Methods
This investigation was approved by an Institutional Ethics Committee (CCPPRB, Paris).
Subjects
Nine normal volunteers (five men and four women) aged 20–42 years were scanned, after giving their informed consent about the nature of the experiment. All subjects were healthy and had normal uncorrected vision. All but one were right handed, and three had a left ocular dominance (two right-handed subjects had a left ocular dominance).
Image Acquisition
Subjects were scanned in a 3 T whole-body MRI scanner (Bruker, Ettlingen, Germany) with BOLD contrast echo planar imaging (flip angle 90°, TE = 40 ms). Twenty slices covering the whole brain were acquired, roughly perpendicular to the axis of the brainstem. Voxel size was 4 × 4 × 5 mm. Each functional sequence consisted of 76 scans, with a repetition time of 3.05 s. We also performed a high-resolution T1 weighted (IR gradient echo) sequence in order to acquire accurate anatomical information.
Visual Stimulation
Subjects laid supine in the magnet. They wore glasses, consisting of a mirror angled at ~45° from their visual axes, to allow them to see the translucent screen located at the extremity of the magnet on head side. Viewing distance was 1.40 m. Stimuli were projected on the screen using an Eiki 5000 projector driven by a PC computer.
The visual stimuli consisted of 300 anti-aliased dots (6 pixels width) and a central fixation cross; both the dots and the cross were displayed in green over a black background. The stimuli covered a 16° diameter region, each dot subtending 0.27°. Global luminance was 1 cd/m², and subjects experienced no colour after effect.
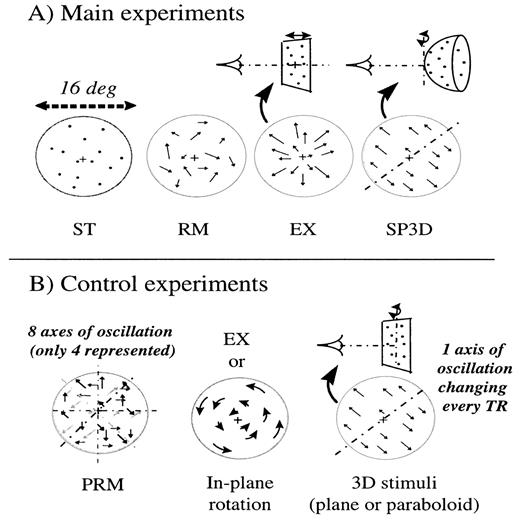
In this experiment, four different stimuli were used (Fig. 1A):
Stimulus ST: stationary dots.
Stimulus RM: moving dots with random direction and random displacement amplitude. Dot speed varied sinusoidally with time (frequency: 1 Hz). Direction and amplitude of motion were changed to new random values at each speed zero crossing. Maximal dot speed was 3.3°/s and mean speed over the block of stimulation was 1°/s.
Stimulus EX: moving dots in alternated expansion and contraction (frequency: 1 Hz). Dot speed ranged from 0 to 2.4°/s with a mean speed of 1°/s. Such a stimulus can be considered as coherent motion with little, or ambiguous, structure information. Indeed, a sphere moving back and forth would yield almost the same perceptual sensation as a plane moving the same way, so that it would not be possible to distinguish between both shapes. The same ambiguity would arise should motion be a rotation around the observer. The reason is that frontoparallel translation only can provide reliable structure information (Longuet-Higgins and Prazdny, 1980). At 16° visual angle, we found that the frontoparallel component of motion in the EX stimulus was in average 9.3% of its value in the SP3D stimulus described below. We hence considered structure information in the EX stimulus to be one-tenth that of structure information in the SP3D stimulus.
Stimulus SP3D: dots moved as if they belonged to a spherical surface S of radius 38 cm (15.1° visual angle) rotating around a frontoparallel axis tangent to S. We constructed the stimulus by projecting a 2-D random dot distribution onto the virtual 3-D surface, so that there was no density bias at the edges of the sphere. Then, the 3-D position of the dots on the oscillating sphere were back-projected onto the screen at each frame. This rotation yields a pattern of coherent motion, and is optimal for the non-ambiguous perception of structure from motion parallax (Cornilleau-Pérès and Droulez, 1994). The direction of the rotation axis was randomly chosen in the first occurrence of the stimulus, and then incremented by 45° on each of the next three occurrences. Each time the spherical surface reaches its extremal position or a frontoparallel position (i.e. four times per 3-D oscillation) the 2-D dot velocity passes through zero. Hence the frequency of the 2-D velocity is twice the frequency of the 3-D motion. Therefore, the frequency of the 3-D motion was chosen to be 0.5 Hz so that the 2-D dot velocity frequency was 1 Hz, as for other motion stimuli. Dot speed ranged from 0 to 4.7°/s, with a mean value of 1°/s.
In each stimulus image, dots were uniformly spread over the viewing window. The frame rate was 70 Hz. Dots that moved outside the viewing window between two successive frames were randomly repositioned within the window in the second frame. This was done under the constraints that (i) dot density was kept uniform over the window and (ii) the average dot flicker (number of dots appearing and disappearing in the window in each frame) was kept similar for the three motion stimuli (RM, EX, SP3D). Hence the number of dots inside the window, and therefore the luminance, were constant across the different stimuli. Also, the following parameters were equalized for the three motion conditions (RM, EX and SP3D):
the average dot flicker (3.9 dots/frame);
the average dot velocity (1°/s);
the variation frequency of the dot 2-D speed (1 Hz).
Design
The volumes of functional images were acquired while subjects viewed two stimuli, hereafter denoted S1 and S2, alternately. S1 was first presented during 36.6 s (12 scans), then S2 and S1 were alternately displayed during 24.4 s (eight scans) each, for a total duration of 3 min 52 s (= 36.6 + 8 × 24.4 s). Each subject underwent three experiments:
Motion experiment: stimuli ST and RM were alternated. The goal of this experiment was to locate visual motion areas.
Expansion experiment: stimuli RM and EX were alternated. This aimed at determining whether specific cortical structures are dedicated to the processing of coherent motion, as compared with random motion, when little or no depth information is provided by motion parallax.
3-D shape experiment: stimuli RM and SP3D were alternated in order to show structures dedicated to the perception of 3-D shape from motion. We also expect this experiment to highlight areas involved in the processing of coherent motion.
The order of the three experiments was randomized across subjects. Subjects were instructed to lie still, fixate the central fixation cross and attend the visual stimulus. Sequences were separated by rest (no scanning) periods of 4–5 min. After completion of the scanning sessions, subjects were asked to report on their different visual and non-visual percepts while in the scanner.
Image Analysis
Data were pre-processed and analyzed using SPM96 (Friston et al., 1995). For each subject, all functional volumes were motion-corrected using sinc interpolation and normalized in the Talairach stereotactic system of coordinates. The normalization was done by using linear transformations to match the anatomical images with the Montreal Neurological Institute template. Functional volumes were then spatially smoothed with a 5 mm width Gaussian kernel. The voxel size of the normalized volumes was set to 3 × 3 × 3 mm. The first four scans of each experiment (a series of 76 scans), acquired during the transition to the steady state of the magnetic resonance signal, were discarded.
Data were analyzed both on a group and on a subject per subject basis. For subject and group analyses, the three experiments were modelled with separate blocs of covariates. For each experiment, the stimulation paradigm was modelled as a box-car function modified to take into account the hemodynamic function delay, rise and fall time. Low frequency trends were modelled as confounding effects with discrete cosine functions (cut-off period = 96 s = twice the paradigm period).
Modelled effects were fitted to the BOLD signal on a voxel per voxel basis using standard least-square estimation procedures in linear model theory. Voxels for which effects of interest accounted for a significant part of the signal variation were kept for further analysis (i.e. voxels surviving F-test, P < 0.001). For both individual and group analyses, the statistical parametric maps (SPM{Z}) corresponding to contrasts RM–ST, ±(EX–RM) and ±(SP3D–RM) were generated.
Additionally, the SPM{Z} corresponding to the (SP3D–RM)–(EX–RM) contrast was also calculated for the group analysis. Since stimuli SP3D and EX were always presented in separate experiments, this contrast was not computed on an individual basis, because it may reveal nothing but random effects between sessions. In the group analysis, these effects should average across subjects, since the order of the experiments was randomized across subjects.
We performed the group analysis with an exploratory perspective. The type II error (risk of not detecting a region that is activated) was limited by choosing permissive thresholds at the voxel (Z intensity) and cluster size (spatial extent) levels. SPM{Z} for the group were thresholded at Z = 2.33 (P = 0.01), and clusters were kept for further analysis if (i) their volume was >190 mm3 and (ii) their corrected probability for the conjoint test (maximum intensity and spatial extent) was <0.5
Regions highlighted by the group analysis were subsequently tested on an individual basis. The threshold at the voxel level was chosen more conservative than for the group analysis (Z = 3.09, P = 0.001) and regions were taken into account if their volume reached at least 190 mm3 (P = 0.056).
This methodology allowed us to study the functional intersubject variability while limiting the risk of false negative results.
Distortion Correction and Anatomical Localization
At 3 T, the T2*-weighted EPI sequence yields some distortion relative to the T1-weighted anatomical images, which results, in the functional images, in a compression of the occipital lobe along the antero-posterior axis of the slices (i.e. in the phase encoding direction). This compression was estimated for each subject. For five subjects, the distortion was or could be corrected to <4 mm [using Jezzard and Balaban's correction algorithm (Jezzard and Balaban, 1995)]. For the other four subjects, the distortion was >4 mm (up to 13 mm along y and 7.5 mm along z) and could not be corrected. These later data were not used for anatomical localization in the occipital pole. Distortion of the posterior part of the brain was negligible in the 10 upper slices.
The approximate anatomical locations of activity foci for the group results were derived from their stereotactic coordinates (Talairach and Tournoux, 1988). To achieve a better precision in anatomical localization, the group analysis was repeated including only the five subjects with smallest distortion. Because no marked difference was observed between this analysis and the previous one, we present results obtained with all subjects included in the analysis.
Results
Activation Magnitude in Volume and Amplitude
Figure 2 indicates, for each subject and each contrast, the volume that corresponds to the number of suprathreshold voxels, denoted ‘activity volume’. The use of a lower threshold (P < 0.01 instead of P < 0.001) for individual analyses only slightly increased these volumes, indicating the robustness of the procedure. Figure 2 also indicates the median of the activity volume across subjects, and its value in the group analysis.
The RM–ST contrast clearly presented the largest activity volume for all subjects but one (subject VH) (see Fig. 2). The percentage of signal change over time reached up to 12% in this contrast and was <3% in the others.
For other contrasts, results were more variable across subjects in terms of the activity volume rank. The general trend, however, is that the SP3D–RM contrast yielded the strongest activity, while the RM–SP3D contrast showed the weakest response.
Activation Localization
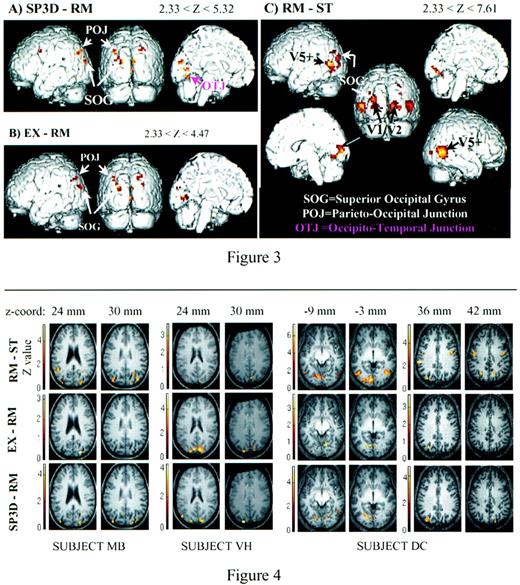
Figure 3 presents an overview of the results of the group analysis for the SP3D–RM, EX–RM and RM–ST contrasts, showing on the anatomical template the location of suprathreshold regions, for which Z scores are given in Table 1. Figure 3C shows the location of the large activity volume of the RM–ST contrast, while Figure 3A and Figure 3B highlight the similarities between the activity loci for contrasts SP3D–RM and EX–RM respectively.
Table 1 lists the foci found for each contrast in the group analysis and Table 2 indicates the number of subjects who showed a response in the areas delineated by the group analysis.
The pattern of activity in the dorsal regions being very similar for both coherent versus random motion contrasts, this suggests that EX and SP3D stimuli may be processed by identical dorsal cortical structures.
Random Motion versus Static
The RM–ST contrast yielded similar results for all subjects, with activity volumes ranging between 3.5 and 39.5 cm3. This contrast operationally defines the regions, denoted ‘motion areas’ in the following, involved in visual motion processing. These are the bilateral middle-temporal complex (V5+), the left SOG (lSOG; V3/V3A), the bilateral lingual and middle occipital gyri (V1/V2), and the ventral part of the occipito-temporal junction.
Bilateral Middle-temporal (V5+) Complex.
Using individual data, we located V5+ on both hemispheres for all subjects. A maximum deviation of ~20 mm was found on the location of this region in the Talairach coordinates, a figure consistent with Watson et al.'s findings (Watson et al., 1993). For subjects allowing precise anatomical localization, this region clearly followed the anterior occipital sulcus (ascending branch of the inferior temporal sulcus) at the lateral occipito-temporal junction.
Left Superior Occipital Gyrus (V3/V3A).
The lSOG was found activated for seven subjects. This region was at the border between the dorsal cuneus (medial occipital gyrus) and the lateral occipital cortex, in the intra-occipital sulcus.
Bilateral Lingual and Middle Occipital Gyri (V1/V2).
Individual analyses showed that the most occipital regions, as well as bilateral V5+ complex, were active for all subjects.
Ventral Part of the Occipito-temporal Junction.
This region was active for six subjects. The anatomical study of the ventral part of the brain is more difficult with a 3 T MR scanner, as distortion of T2* images can exceed the voxel size in this region. However, in subjects with anatomical images of negligible distortion, we could locate this region along the posterior part of the collateral sulcus, anterior to V1/V2 (see Figure 4, subject DC, z-coordinates = –9 and –3 mm).
Coherent Motion (SP3D or EX) versus Incoherent Motion
EX–RM and SP3D–RM contrasts of the group analysis delineated regions in similar locations, with Z-scores ranging from 2.33 to 5.17 (Table 1). The occipito-temporal junction was only found for SP3D–RM.
The Superior Occipital Gyrus (SOG).
Both group and individual analyses showed overlapping regions of activity in the dorsal SOG for RM–ST, EX–RM and SP3D–RM comparisons. The dorsal SOG was more active for SP3D compared with RM (Z = 5.32, pc = 0.002) and for EX compared with RM (Z = 4.17, pc = 0.219, uncorrected P < 10–4). Because this region was also clearly delineated as a motion area by the RM–ST contrast, it seems to be active for all motion stimuli, with enhanced activity for coherent motion as compared with random motion, this being significant for the SP3D–RM contrast. In the group analysis, the activity was located mainly in the left hemisphere for RM–ST, but individual data failed to confirm a systematic left lateralization. The activity in the dorsal SOG for EX–RM and SP3D–RM was confirmed for five and six subjects respectively. It was usually located in the intra-occipital sulcus, reaching dorsally the parieto-occipital sulcus (e.g. Fig. 4, subjects MB and VH).
Although we could not differentiate V3 from V3A in our data, the anatomical and functional descriptions given by Tootell et al. (Tootell et al., 1997) suggest that this region might correspond to V3A, which presents a higher sensitivity to visual motion than V3.
The Parieto-occipital Junction (POJ).
In the group analysis, the parieto-occipital junction exhibited a higher BOLD signal consistently for coherent versus incoherent motion in both hemispheres (region POJ for EX–RM and SP3D–RM in Fig. 3A,B). As indicated in Table 1, this activity was moderate (Zscore ranging between 4.05 and 4.47). In individual data (Table 2), four subjects for EX–RM and five subjects for SP3D–RM presented suprathreshold activation in this region. For these subjects, the region was located anatomically at the junction between the superior parietal lobule and the SOG (see Fig. 4, subject DC). It extends along the posterior part of the intraparietal sulcus and/or the intra-occipital sulcus, as the limit between those two sulci is usually impossible to delineate (Duvernoy, 1992). Following Eidelberg and Galaburda (Eidelberg and Galaburda , 1984) and Cheng et al. (Cheng et al., 1995), the cortex in the intraparietal sulcus was assigned to the superior parietal lobule rather than to the inferior parietal lobule.
The Ventral Part of the Occipito-temporal Junction (OTJ).
In the ventral part of the temporo-occipital junction (region OTJ on Fig. 3A), the group analysis showed activity (Z = 4.48, pc = 0.071, uncorrected P < 10–5) for the SP3D–RM contrast but no detectable activity for EX–RM (Z < 2.33). Also, ‘(SP3D–RM)– (EX–RM)’ contrast was positive in this region (Z = 3.23, uncorrected P < 0.001).
From individual analyses, six of the nine subjects showed clear BOLD signal modulation for SP3D–RM in the OTJ region. For our less distorted anatomical images, voxels activated in the SP3D–RM contrast lie along the collateral sulcus, at the border between the fusiform and lingual gyri, close to the ventral part of the lingual motion areas as determined by the RM–ST contrast (see Fig. 4, subject DC, z-coordinates = –9 and –3 mm). When comparing EX to RM, only two subjects presented activity in this ventral region, confirming the negative result of the group analysis.
As the occipto-temporal junction had also shown very significant activity (Z = 5.42, pc = 0.002) for the RM–ST contrast, this region seems sensitive to the three motion patterns, possibly with higher activity for the SP3D stimulus.
The V5 Complex (V5+).
From the group analysis, V5+ did not present any significant changes of signal in contrasts comparing motion stimuli (EX–RM, SP3D–RM or RM–EX, RM–SP3D). In individual analyses, EX–RM and SP3D–RM contrasts highlighted some activity in the vicinity of V5+ for three and four subjects respectively, but these regions were small, in terms of volumes and Z-score values, and located in various positions relative to V5+. For six of the nine subjects, the activity in V5+ itself tended to be slightly but non-significantly higher for the random motion pattern than for the coherent motion. Therefore, within the precision of our investigation, V5+ presented a similar BOLD activity level for all three motion patterns.
Opposite Contrast.
The opposite contrasts between incoherent and coherent motion stimuli (RM–EX and RM–SP3D) yielded a locus of activity in the most posterior part of the right lingual gyrus. Such activity could be due to zero velocity in the centre of the image for coherent motions, possibly producing a differential activity in the part of V1/V2 corresponding to central vision (posterior part of the lingual gyrus). At the threshold used here, however, this effect remains small and can be seen only in a limited part of the retinotopic motion areas, not in the SOG nor in V5+.
Control Experiments
Stimuli RM, EX and SP3D differed mainly in their motion coherence and 3-D content. However, two factors may interfere in the interpretation of the main experiments. First the speed distribution is uniform across the image in stimulus RM but not in EX and SP3D, where dots move faster as their eccentricity increases. Second, because SP3D represents a spherical surface, the specific SP3D activities found in OTJ, for instance, might be due to surface curvature rather than to the perception of a surface shape in general. The following experiments aimed at controlling the role of speed distribution and surface curvature in the activity of the regions highlighted by the SP3D–RM contrast.
Materials and Methods
Four subjects (three female and one male, aged 20–34 years) were scanned. Unless otherwise stated, the methods were similar to those used for the main experiments.
Image Acquisition
The voxel size of the functional images was 3.75 × 3.75 × 6 mm and each functional sequence consisted of 133 scans, with a repetition time of 2 s. These parameters are close to those used in the first series of experiments and should not introduce any bias in the interpretation of the results.
The distortion between functional and anatomical images could be corrected in all four subjects.
Visual Stimulation
We used six different stimuli, that presented the same global characteristics as the stimuli described for the main experiments. Their peculiarities are detailed as follows (Fig. 1B):
3-D stimuli: these stimuli were similar to SP3D except that (i) they represented a paraboloid, or a plane, rather than a spherical surface and (ii) the rotation axis was changed every 2 s, spanning eight directions during the 16 s block of presentation. Here we replaced the sphere by the paraboloid in order to simplify the programmation of stimuli and make possible the design of the complex control stimuli hereafter. Care was taken that our paraboloid represented a close approximation of the sphere within our stimulus window, and yielded a similar percept of a curved surface rotating in depth.
2-D pseudo-random stimuli (PRM): simultaneous presentation of eight surfaces rotating in different directions. These stimuli were similar to the 3-D stimuli, except that the dots were divided in eight sets which were all affected a given motion direction and sign (for each oscillation axis, as represented in Fig. 1B, two rotation directions of opposite sign can be defined). Hence all 3-D movements of the 3-D stimulus were presented simultaneously, as if eight transparent surfaces were rotating in depth around different rotation axes. Because of this large number of surfaces, these stimuli appeared as completely devoid of any 3-D shape information. Each of the 3-D stimuli, paraboloid and plane, had its corresponding 2-D pseudo-random stimulus obtained with the same underlying surface shape. Also, in order to maintain the same frequency of dot speed variation as in the 3-D stimuli, we changed the motion direction of the eight oscillating surfaces every 2 s.
2-D coherent stimuli: dots moved either in expansion/contraction (as in EX) or in clockwise/counterclockwise rotation (ROT) about an axis perpendicular to the screen plane and passing through the centre of the viewing area. Both movements yielded little or no information about the underlying 3-D shape.
As in the main experiments, all stimuli had the same average dot speed and frequency of variation of that speed. By construction, the 3-D stimuli and 2-D pseudo-random stimuli had the same speed distribution over one block.
Design
3-D stimuli versus 2-D pseudo-random stimuli: the 3-D plane, paraboloid and their 2-D pseudo-random counterparts were alternated. The goal of this experiment was to test the specific influence of the 3-D structure, the speed distributions being equalized over the block duration.
3-D stimuli versus 2-D coherent stimuli: the 3-D plane, paraboloid and the two types of 2-D coherent motion were alternated.
Stimuli were displayed in a pseudo-random order, following a block design, each block during 16 s (eight TR). In both experiments, each stimulus was presented four times. Experiments were repeated twice for each subject.
Specific analysis
A group analysis was performed on the data of the four subjects. The aims were, first, to confirm that the activity found in (SP3D–RM) and (EX–RM) contrasts was not merely due to differences in speed distribution, and second, to test whether areas found in (SP3D–RM) were sensitive to the presence of coherent motion, curvature or 3-D structure information. Hence, SPM{Z} maps were generated to compare directly:
3-D stimuli with their pseudo-random counterpart (same speed distribution). To show activation common to both type of 3-D stimuli, we computed the conjunction of (3-D plane–control for plane) and (3-D paraboloid–control for paraboloid) contrasts;
3-D stimuli with coherent motion (coherent motion with or without 3-D structure information): (3-D plane + 3-D paraboloid)–(expansion + rotation);
the 3-D paraboloid with the plane (same 3-D motion, but different curvature).
Investigations were bounded in boxes of 15 × 15 × 15 mm around the coordinates of maximum activity found in the (SP3D–RM) contrast.
Results
Table 3 presents the results of the group analysis in the areas highlighted by the SP3D versus RM experiment. Although only the left OTJ was significantly activated in the (SP3D–RM) contrast, we also explored the right OTJ, since this area might have suffered from distortions in the main experiments. Results are corrected for multiple comparison in these volumes.
The conjunction between the two contrasts (paraboloid– PRM) and (plane–PRM) confirmed that the SOG (Z = 3.31, pc = 0.049) and the left and right POJ (respectively Z = 3.57, pc = 0.023 and Z = 5.71, pc < 0.001) were more activated by any 3-D stimulus than by random motion. However, neither left or right OTJ appeared to be commonly activated by the two 3-D stimuli as compared with their control.
The contrast between the paraboloid and the oscillating plane showed that most of the areas found with the SP3D–RM contrast were actually specifically sensitive to curvature. In particular, the left and right OTJ presented a strong difference of BOLD signal when comparing the paraboloid to the plane (left: Z = 4.42, pc = 0.001; and right: Z = 4.49, pc < 0.001). Hence, we can interpret the activity of the OTJ in the (SP3D–RM) as the OTJ being sensitive to the 3-D structure of the SP3D stimulus.
It should be noted that this sensitivity to curvature does not explain the activity of the SOG and POJ in the conjunction of both (plane–PRM) and (paraboloid–PRM) contrasts.
Finally, the contrast between 3-D stimuli and coherent motion stimuli showed that all areas found in the SP3D–RM contrast were on average more sensitive to 3-D stimuli than to other coherent motion stimuli (expansion and in-plane rotation). For the SOG, right POJ and OTJ, this can be explained partly by their sensitivity to the paraboloid curvature. However, this is not likely to be so for the left POJ, which was not found sensitive to the structure of the 3-D stimulus.
Summary
The random motion versus static experiment clearly delineates motion areas, with a high level of significance and robustness relative to the threshold used. These motion areas consist mainly of the occipital pole (V1/V2), the temporo occipital V5 complex and the SOG.
Coherent versus incoherent motion experiments generally yield lower modulations of the BOLD signal than the motion versus static experiment. In particular, in V5+ and its vicinity, group results show little or no change of activity when comparing EX or SP3D with RM. This suggests that the cortical activity induced by RM, EX or SP3D as compared with a static stimulus largely overlap and are located mainly in the previously described motion areas.
Regions that are specifically highlighted by coherent versus incoherent motion comparison are found mostly in the dorsal pathway. Both contrasts EX-RM and SP3D-RM showed the same pattern of activation in the dorsal pathway.
The contrast between the paraboloid and the plane rotating in depth shows activity in all regions highlighted by the contrasts EX–RM and SP3D–RM, except the left POJ. Hence, the BOLD response in these areas appears to be modulated not only by motion coherence, but also by surface curvature.
Three regions seem to be involved specifically in the 3-D processing of optic flow:
The lSOG is sensitive to random motion (RM–ST contrast) and its BOLD signal increases gradually from random motion to coherent 2-D motion, and from the plane rotating in depth to the paraboloid rotating in depth. Hence, the activity of SOG appears to depend on the 3-D content of the stimulus.
The dorsal POJ is not sensitive to random motion (RM–ST contrast) but rather to coherent motion (SP3D–RM and EX–RM). This activity is bilateral, and the POJ shows an increased activity when 3-D stimuli are contrasted with other 2-D coherent motions in our control experiments. Also the right POJ is sensitive to surface curvature (contrast between paraboloid and plane rotating in depth).
The ventral side of the OTJ is sensitive to motion (RM-ST contrast) but does not appear to respond preferentially to motion coherence, contrary to the two dorsal regions. However, a higher level of activity is obtained when contrasting a curved surface rotating in depth (sphere or paraboloid) to random motion or to the rotating plane, showing that the OTJ is sensitive to surface curvature.
Discussion
Possible Influence of Oculomotor Activity on the Results
From both the experimental design and the activation results, it is unlikely that conclusions of this study are affected by eye movements. In the experimental protocol, subjects were instructed to carefully fixate the central fixation cross, and the sum of velocity vectors around the fixation cross was designed to be exactly zero for all our stimuli. [In the random motion stimulus, the direction of dot motion is randomized; in the expansion/contraction stimulus, velocities on each side of the image center are of similar magnitude but of opposite direction; in the sphere stimulus, the velocity pattern is that of an expansion/contraction pattern in the direction orthogonal to the rotation axis. As a result, the vector sum of dot velocities is null on average for all motion stimuli.] As for the data analyses, no activity was found in the prefrontal and frontal cortex, where areas involved in the generation of saccades are located (Kandel et al., 1991). Smooth pursuit or optokinetic nystagmus (OKN) may have differed across stimuli. However, if this were the case we would then expect a corresponding variation of the amount of corrective saccades to the fixation centre. As stated above, such a variation is not likely to have occurred in a systematic way in our experiments. Finally, we cannot rule out the possibility that the suppressive mechanisms associated with OKN and smooth pursuit might play a role here, particularly as our dorsal regions of activity are located near the posterior parietal regions known to be involved in these oculomotor activities.
Possible Influence of the Subject Attention on the Results
Passive vision might be the cause of the intersubject variability observed here and in previous studies of coherent motion processing (de Jong et al., 1994). This is suggested by an increasing number of cortical imagery experiments demonstrating the modulation of activity in cortical regions as a function of attention. More specifically, results in monkey studies as well as in human imagery work (Corbetta et al., 1991) show that the neuronal activity in different visual cortical areas can be strongly dependent on the attended visual attribute. More precisely, in V5+ the level of activity is known to depend on spatial and featural attention (Beauchamp et al., 1997; O'Craven et al., 1997) but also on the attentional load (Rees et al., 1997). Therefore, part of the interindividual variability observed here could be due to variations in the attentional state of our subjects and also to the attendent attribute (e.g. surface curvature, 3-D movement).
Given that the parietal lobe plays an important role in spatial attention and spatial representation [for a review see (Andersen, 1987)], the dorsal occipito-parietal activities detected by the present study for coherent versus incoherent motion comparisons might be due to attentional variations occurring at the onset of each coherent motion field. However, these activities are located systematically below the parietal foci highlighted by spatial attention shifts in Corbetta et al.'s study (Corbetta et al., 1995).
Interestingly, the parieto-occipital cortex seems to play a prominent role in visual feature binding (Friedman-Hill et al., 1995). It may not be surprising, therefore, that this region is involved in the coding of coherent motion, which requires a spatial grouping of local motion signals.
Motion-sensitive Areas: Comparison with Previous Results
The results of our RM versus ST experiment are in close agreement with previous studies. In particular, the coordinates of V5+ are similar to what has been found in other functional magnetic resonance imaging (fMRI) or PET studies [for a review see (McCarthy et al., 1995); and see Figure 5). Also, the other motion areas (V1/V2 and the SOG) delineated by the contrast between random motion and stationary dots correspond to regions found by others (Dupont et al., 1994; McKeefry et al., 1997 ).
Motion Coherence: Comparison with Previous Results
We compared our results with three cortical imaging studies on coherent motion (de Jong et al., 1994; Cheng et al., 1995; McKeefry et al., 1997) and summarize the results in Table 4. de Jong et al. used a coherent stimulus that consisted in an expansion flow of dots located on a horizontal plane (‘heading’ flow) which was alternated with an incoherent flow, obtained by randomizing the directions of dot velocities. Cheng et al. and McKeefry et al. used an array of dots moving coherently in one direction compared with dots moving each in a randomly selected direction. The main results are as follows.
All studies, except Cheng et al.'s, fail to find a satellite of MT/V5 which would be involved in the coding of coherent rather than random motion, and could be an analogous to monkey MST. This may be due (i) to strong anatomical differences between the monkey and human dorsal visual pathways, the equivalent of area MST in human being possibly located further in the posterior parietal cortex (e.g. the POJ region); (ii) to the size of the field of view, since relatively small-field stimuli may fail to activate a possible human analogue to area MST. Note that Cheng et al.'s results also differ from other studies in that no equivalent to MT/V5 is found in their incoherent versus static comparison.
Cheng et al., de Jong et al. and our study report that the most salient focus of contrast between coherent and incoherent motion is found in the SOG. [Although more inferior, the activity found in the cuneus by de Jong et al. (centroid 22, –86, 4) could correspond to the region we found located at z = 27 mm and z = 21 mm in the EX–RM and SP3D–RM contrasts respectively. This occipital area corresponds to the highest Z-scores in these comparisons. Foci are located in the right hemisphere in Cheng et al. and in de Jong et al. while they are located in the left hemisphere in our study. However, neither de Jong et al. nor the present study could confirm the unilateral activity on an individual basis.] It is worth noting that, in our study, this region was also sensitive to random motion (RM–ST contrast). It might hence correspond to V3A, known to show a higher sensitivity to motion than V3 in man (Tootell et al., 1997).
Our POJ foci of activity for EX–RM and SP3D–RM are close to the latero-posterior precuneus focus reported by de Jong et al. at position (22, –76, 36) for coherent versus incoherent motion. Alternatively, for the same contrast, Cheng et al. report more lateral foci, in the inferior parietal lobule.
Cheng et al. and de Jong et al. report ventral activities for the contrasts between coherent and incoherent motion. This is somewhat contradictory with our results, since the stimuli used by these authors elicit a plane percept (frontoparallel or horizontal), whereas ventral activities are seen in our coherent versus incoherent motion comparison only when the coherent motion represents a curved surface rotating in depth. Given the large fields of view they used, their stimuli might elicit a stronger 3-D percept than our expansion. We discuss in the last section the possible role of 3-D shape content on the activity of ventral areas.
3-D Structure from Motion and Motion Coherence: the Dorsal Pathway
The similarity of patterns between contrasts EX–RM and SP3D–RM shows that, despite the difference in their depth information contents, EX and SP3D stimuli are probably processed by similar cortical areas.
These areas, however, as detailed in the second Results section, present a gradation of activity depending on the type of motion pattern. Overall, in the dorsal areas (POJ and SOG), curved surfaces tend to elicit more activity than planes or 2-D coherent motion, which in turn elicit more activity than random motion.
As stated in the Introduction, the rotating surfaces and 2-D coherent stimuli (EX or ROT) may all induce a percept of a 3-D shape, but the percept is theoretically and psychophysically stronger for a curved surface rotating in depth. Therefore the results seem to demonstrate, in the two dorsal regions, a parallel between the BOLD signal and the perceptual strength of the stimulus in terms of 3-D shape.
Hence, although these regions do not show a clear-cut response to motion parallax or specific activity for one stimulus only, their graded activity makes them good candidates to participate in the processing of 3-D structure from motion.
3-D Structure from Motion: the Ventral Pathway
In contrast to the dorsal areas, the ventral part of the OTJ, as highlighted by the contrast SP3D–RM, does not appear to be sensitive to coherent motion in general, but only to the rotation in depth of a curved surface. Indeed, in this area the curved surfaces yield a higher signal than all other coherent and random patterns of motion, which are at similar levels. Because of its location and specific activity, the role of the OTJ is likely to be different from dorsal areas.
The OTJ region is close to the latero-occipital region (LO) reported by Malach et al. (Malach et al., 1995) as being active when objects rather than random contrast distributions are presented. It should be noted, however, that the LO region is located on the lateral aspect of the fusiform gyrus, at coordinates (43 –73 –18), whereas the OTJ was found on its medial aspect, adjoining the lingual gyrus. In a PET study, Martin et al. (Martin et al., 1996) confirmed that activity can be evoked in the fusiform gyrus by presenting either meaningful or nonsense 3-D objects, suggesting that part of this activity does not depend on stimulus semantic content. In their study, two main locations were found, one posterior and one anterior to the OTJ. Complementary to this, Schacter et al. (Schacter et al., 1995) have proposed that inferior temporal and fusiform gyri activity could be specifically associated with manipulating structurally coherent 3-D objects but not with manipulating 2-D shapes.
The fact that the OTJ region is also sensitive to random motion, as compared with static dots, is not incompatible with the literature, as some authors found direction selective cells in area V4 of the monkey (Cheng et al., 1994). Moreover, Van Essen and Drury (Van Essen and Drury, 1997) describe a region in the ventral part of the posterior OTJ (near areas VP and V4v) that would be involved in both motion and form processing. From anatomical and functional criteria, this area could correspond well to OTJ.
On the one hand, activation of the ventral pathway is commonly associated with experiments involving the perception of the structure of static objects. On the other hand, our results show that the OTJ is sensitive to the structure of a 3-D object only defined from motion. The conjunction of these results supports the involvement of the ventral visual pathway in the coding of the 3-D shape independently of depth cues (static or dynamic).
Conclusion
Our results confirm previous findings concerning the involvement of the SOG and the POJ in coherent motion processing, while a specific role of V5 in both coherent motion and 3-D structure from motion processing remains questionable.
Moreover, we propose that the lSOG, which shows a graded sensitivity to random motion, coherent motion and 3-D stimuli, is a locus of motion parallax processing. The POJ, which is not found to be sensitive to random motion but is activated by coherent motion and object curvature, might be involved in coding object shape and motion at a higher level. As for the ventral part of the OTJ, it appears to be involved in object ‘complex’ structure reconstruction either from motion cues, as suggested by our results, or static cues, as suggested by other studies.
Finally, our results support the existence of a coding of 3-D shape from motion in both the dorsal and ventral visual pathways. Therefore, whether the coding of 3-D shape from motion is mediated by the projections of dorsal areas sensitive to motion coherence onto the ventral visual pathway becomes a critical question for exploring the mechanisms of perception of 3-D space and object shape.
Notes
This work was supported by the ACC-SV program from the French Ministry of Research (no. 951261/12) and by the École Nationale Supérieure des Télécommunications. A.L.P. is funded by CEA and IFSBM.
Address correspondence to A.-L. Paradis, LPPA, Collège de France, 11 place Marcelin Berthelot, F-75005 Paris, France. Email: paradis@shfj.cea.fr.
Talairach coordinates of the local maxima of the SPM{Z} from the group analysis
| Location | Left hemisphere | Right hemisphere | ||||
|---|---|---|---|---|---|---|
| Talairach (x,y,z) | Z-score | pc | Talairach (x,y,z) | Z-score | +pc | |
| Regions listed above are determined from the group analysis (nine subjects). Z maps were thresholded at Z = 2.33 (P < 0.01). Maximum Z-score values are indicated, as well as the probability pc (corrected for multiple comparisons) that these values occur by chance. | ||||||
| Experiment 1: random motion–static (RM–ST) | ||||||
| V5+ | (–51,–72,3) | 7.61 | <0.001 | (45,–54,6) | 7.59 | <0.001 |
| Dorsal SOG (V3/V3A) | (–27,–81,15) | 6.56 | <0.001 | |||
| Posterior lingual gyrus (V1/V2) | (–12,–81,–3) | 6.19 | <0.001 | (27,–84,0) | 7.26 | <0.001 |
| OTJ | (–24,–66,–12) | 5.42 | 0.002 | (21,–66,–6) | 5.93 | <0.001 |
| Experiment 2: expansion/contraction–random motion (EX–RM) | ||||||
| Dorsal SOG (V3/V3A) | (–24,–84,27) | 4.17 | 0.219 | |||
| POJ | (–30,–63,33) | 4.05 | 0.316 | (18,–79,39) | 4.47 | 0.075 |
| Experiment 2. Random motion–expansion/contraction (RM–EX) | ||||||
| Posterior lingual gyrus (V1/V2) | (15,–90,3) | 4.65 | 0.036 | |||
| Experiment 3: 3-D sphere–random motion (SP3D–RM) | ||||||
| Dorsal SOG(V3/V3A) | (–18,–87,21) | 5.32 | 0.002 | |||
| OTJ | (–24,–69,–9) | 4.48 | 0.071 | |||
| POJ | (–33,–78,39) | 4.44 | 0.084 | (21,–78,39) | 4.09 | 0.282 |
| Experiment 3: random motion–3-D sphere (RM–SP3D) | ||||||
| Posterior lingual gyrus (V1/V2) | (24,–84,0) | 4.01 | 0.360 | |||
Individual results in the areas determined by the group analysis
Individual results in the areas determined by the group analysis
Results of the control experiments in the areas delineated by the SP3D-RM contrast
| Contrast | lSOG | Left POJ | Right POJ | Left OTJ | ||||
|---|---|---|---|---|---|---|---|---|
| Z-score | pc | Z-score | pc | Z-score | pc | Z-score | pc | |
| For the three contrasts of the control experiments, are indicated the maximum Z-values found in boxes (15 × 15 × 15 mm) centered around the voxels of maximal intensity highlighted by the (SP3D–RM) contrast. We also give the probability, corrected for multiple comparisons on the basis of the box size, that this value was reached by chance. X indicates that no voxel above Z = 2.33 (P = 0.01) was found in this box. | ||||||||
| aThe 3-D structure–random comparison was computed as the conjunction of (paraboloid–random) and (plane–random) contrasts, in order to estimate the common effect of both 3-D stimuli. | ||||||||
| 3-D structure–randoma | 3.31 | 0.049 | 3.57 | 0.023 | 6.54 | <0.001 | X | |
| 3-D structure–coherent | 3.76 | 0.008 | 4.26 | 0.001 | 5.71 | <0.001 | 3.58 | 0.014 |
| 3-D curvature–3-D plane | 4.14 | 0.002 | X | 3.70 | 0.009 | 4.42 | 0.001 | |
Four human studies of the cortical processing of coherent vs incoherent motion: summary of results in the occipital, parietal and temporal lobes.
| Study | ||||
|---|---|---|---|---|
| (Cheng et al., | 1995) | (McKeefry et al., | 1997) | |
| The main specifications of the stimuli are indicated in lines 1–4. Incoherent motions had randomly varying directions of dot velocities. The four studies measured both the contrasts between coherent versus incoherent motion and incoherent versus coherent motion (except for Cheng et al.). incoh = incoherent motion; coh = coherent motion. Lines 7–11 indicate which contrast highlights different regions of the cortex. Ipl = Inferior parietal cortex. | ||||
| aThis activity region is very limited as compared with the V1/V2 region delineated by the contrast between random motion and static dots, and is located posteriorally in the lingual gyrus. | ||||
| bThe focus found by Cheng et al. is actually close, but slightly posterior to V5+. | ||||
| (De Jong et al., | 1994) | Current study | ||
| Method | PET | PET | PET | fMRI |
| FOV (width × height) | 80° (square) | 26° × 20° | 40° × 15° | 16° (disk) |
| Coherent stimulus | translation | translation | heading | expansion (EX) sphere (SP3D) |
| Contrasts studied | coh–incoh | coh–incoh incoh–coh | coh–incoh incoh–coh | coh–incoh incoh–coh |
| V1/V2 | incoh–coh | incoh–coha | ||
| V5+ | coh–incohb | incoh–coh | ||
| SOG (V3/V3A) | coh–incoh | coh–incoh | coh–incoh | |
| Ventral OTJ | coh–incoh | coh–incoh | SP3D–incoh | |
| Superior POJ | coh–incoh | coh–incoh | ||
| Ipl (BA 39/40) | coh–incoh | |||
The stimuli used in all fMRI experiments were made of dots randomly positioned over a disk and projected on a transluscent screen. (A) For the main experiments, dots were either stationary (ST), moving with a velocity that varied randomly in direction (RM), moving with alternated expansions and contractions (EX) or moving as if they belonged to a spherical surface oscillating in depth about one of its frontoparallel tangents (SP3D). (B) For the control experiments, we used three types of motion stimuli. In the pseudo-random control stimuli (PRM), dots were moving as if they belonged to transparent 3-D surfaces rotating simultaneously about eight different axes; these stimuli appeared as completely devoid of any 3-D shape information. Coherent motion stimuli corresponded either to EX (see A) or in-plane rotation. In the 3-D stimuli, dots moved as if they belonged to a 3-D surface (plane or paraboloid) oscillating in depth.
Results of the three main experiments. Each panel indicates the total suprathreshold volume of cortex for the following contrasts: RM–ST; EX–RM and its opposite, RM–EX; SP3D–RM and its opposite, RM–SP3D. Each panel corresponds to a subject (individual threshold at Z = 3.09, P < 0.001) or to the group analysis (threshold at Z = 2.33, P < 0.01). The median value of the activity volume for the nine subjects is also indicated.
Results of the group analysis (nine subjects) showing posterior views of the cortex (middle column) as well as lateral and medial views. More details about the activation foci are given in Table 1. (A) The SP3D–RM contrast highlights the SOG, the dorsal part of POJ and the ventral part of the OTJ. In this panel, Z-scores range from 2.33 (P = 0.01) to 5.32. (B) The EX–RM contrast delineates activity foci that are in the SOG and the POJ. In this panel, Z-scores range from 2.33 (P = 0.01) to 4.47. (C) The RM–ST contrast allows the determination of the position of motion areas, in particular the middle temporal V5 complex in the left and right hemispheres. In this panel, Z-scores range from 2.33 (P = 0.01) to 7.61.

Individual data for subjects MB, VH and DC. Comparisons are of RM–ST, EX–RM and SP3D–RM. At the top of each column is indicated the z-location of the slice in the Talairach space. Significant (corrected P value < 0.05) modulations of the BOLD signal are located on the SOG, along the intra-occipital sulcus, for all three contrasts in subject VH, and for the SP3D–RM and RM–ST contrasts in subject MB. For subject DC, the lower slices (z = –9 and –3 mm) show the localization of a ventral focus along the collateral sulcus in the left hemisphere, at the junction between the lingual and fusiform gyri, and between the occipital and temporal lobes. Such a focus was selected by the group analysis as statistically significant for the RM–ST and SP3D–RM contrasts, but not for the EX–RM contrast (see Table 1). The upper slices (z = 36 and 42 mm) show the position of the parieto-occipital activity at the posterior part of the cortex. The foci are located within the intraparietal sulcus, bilaterally for the RM–ST and SP3D–RM contrasts, and on the left hemisphere only for the EX–RM contrast.
Position of V5+ in our study and in seven previous studies (PET or fMRI), as projected in the (y,x) and (z,x) planes of the Talairach system. Filled circles: present study, mean of the five ‘undistorted’ subjects. Empty circles: (1) (McKeefry et al., 1997); (2) (Tootell et al., 1995); (3) (Zeki et al., 1991); (4) (Watson et al., 1993); (5) (Zeki et al., 1993); (6) (Dupont et al., 1994); (7) (Rees et al., 1997).
References
Andersen RA (1987) Inferior parietal lobule function in spatial perception and visuomotor integration. In: Handbook of physiology. The nervous system. Higher functions of the brain (Plum F, Mountcastle VB, eds), pp. 483–518. Rockville, MD: American Physiology Society.
Beauchamp MS, Cox RW, DeYoe EA (
Bradley DC, Qian N, Andersen RA (
Bradley DC, Chang GC, Andersen RA (
Braunstein ML, Andersen GJ (
Bremmer F, Duhamel JR, Ben Hamed S, Graf W (1997) The representation of movement in near extra-personal space in the macaque ventral intraparietal area (VIP). In: Parietal lobe contribution to orientation in 3D space (Thier P, Karnath H-O, eds), pp. 620–630. Heidelberg: Springer Verlag.
Cheng A, Fujita H, Kanno I, Miura S, Tanaka K (
Cheng K, Hasegawa T, Saleem KS, Tanaka K (
Corbetta M, Miezin FM, Shulman GL, Petersen SE (
Corbetta M, Shulman GL, Miezin FM, Petersen SE (
Cornilleau-Pérès V, Droulez J (
Cornilleau-Pérès V, Droulez J (
de Jong BM, Shipp S, Skidmore B, Frackowiack RSJ, Zeki S (
Duffy CJ, Wurtz RH (
Dupont P, Orban GA, De Bruyn B, Verbruggen A, Mortelmans L (
Duvernoy HM (1992) Le cerveau humain. Surfaces, coupes sériées tridimensionnelles et IRM. Paris: Springer Verlag.
Eidelberg D, Galaburda AM (
Faillenot I, Toni I, Decety J, Grégoire M-C, Jeannerod M (
Friedman-Hill SR, Robertson LC, Treisman A (
Friston KJ, Holmes AP, Poline J-B, Grasby BJ, Williams CR, Frith CD, Frackowiak RSJ, Turner R (
Goodale MA, Milner DA (
Jezzard P, Balaban RS (
Koenderink JJ, van Doorn AJ (
Longuet-Higgins HC, Prazdny K (
Malach R, Reppas JB, Benson RR, Kwong KK, Jiang H, Kennedy WA, Ledden PJ, Brady TJ, Rosen BR, Tootell RBH (
Martin A, Wiggs CL, Ungerleider LG, Haxby JV (
Maunsell JH, Van Essen DC (
McCarthy G, Spicer M, Adrignolo A, Luby M, Gore J, Truett A (
McKeefry DJ, Watson JDG, Frackowiack RSJ, Fong K, Zeki S (
Murata A, Gallese V, Kaseda M, Kunimoto S, Sakata H (
Newsome WT, Britten KH, Movshon JA (
Norman JF, Lappin JS (
O'Craven KM, Rosen BR, Kwong KK, Treisman A, Savoy RL (
Orban GA, Lagae L, Verri A, Raiguel S, Xiao D, Maes H, Torre V (
Qian N, Andersen RA (
Rees G, Frith CD, Lavie N (
Regan D, Beverley KI (
Rogers BJ, Graham M (
Rogers BJ, Graham ME (
Roy JP, Komatsu H, Wurtz RH (
Saito HA, Yukie M, Tanaka K, Hikosaka K, Fukada Y, Iwai E (
Schacter DL, Reiman E, Uecker A, Polster MR, Yun LS, Cooper LA (
Schiller PH (
Snowden RJ, Treue S, Erickson RG, Andersen RA (
Tootell RBH, Reppas JB, Kwong KK, Malach R, Born RT,Brady TJ, Rosen BR, Belliveau JW (
Tootell RBH, Mendola JD, Hadjikhani NK, Ledden PJ, Liu AK, Reppas JB, Sereno MI, Dale AM (
Ungerleider LG, Haxby JG (
Ungerleider LG, Mishkin M (1982) Two cortical visual systems. In: Analysis of visual behavior (Ingle DJ, Goodale MA, Mansfield RJW, eds), pp. 549–586. Cambridge, MA: MIT Press.
Van Essen DC, Drury HA (
Watson JDG, Myers F, Frackowiack RSJ, Hajnal JV, Woods RP, Mazziotta JC, Shipp S, Zeki S (
Wurtz RH, Yamasaki DS, Duffy CJ, Roy JP (1990) Cold Spring Harbor Symposia on quantitative biology. Vol LV. Functional specialization for visual motion processing in primate cerebral cortex. Cols Spring Harbor, NJ: Cold Spring Harbor Laboratory Press.
Xiao DK, Marcar VL, Raiguel SE, Orban GA (
Zeki S, Watson JDG, Lueck CJ, Friston KJ, Kennard C, Frackowiack RSJ (